Ferritin and TSAT levels have increased since 20111*
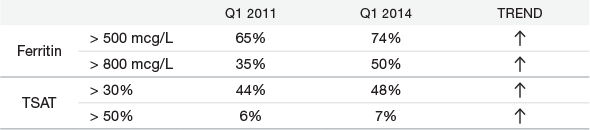
Data are from OutcomesPlus, a national database of clinical data from patients receiving dialysis in facilities across the United States, excluding hospital and governmental entity patients. It contains information about approximately 80% to 85% of the entire US dialysis population. The approximate N for the data described is as follows: Ferritin: Quarter 1 - 2011 N = 375,857, Quarter 1 - 2014 N = 435,812; Transferrin Saturation (TSAT): Quarter 1 - 2011 N = 393,118, Quarter 1 - 2014 N = 452,838.
*Percentage of patients.
*Percentage of patients.
- Evaluate the iron status in all patients before and during EPOGEN® treatment, and maintain iron repletion.
IMPORTANT SAFETY INFORMATION
- EPOGEN® is contraindicated in patients with:
- Uncontrolled hypertension
- Pure red cell aplasia (PRCA) that begins after treatment with EPOGEN® or other erythropoietin protein drugs
- Serious allergic reactions to EPOGEN®
- Use caution in patients with coexistent cardiovascular disease and stroke.
Scroll down for additional Important Safety Information
Guidelines for ferritin and TSAT
- The EPOGEN® PI recommends for patients on hemodialysis and peritoneal dialysis a ferritin level ≥ 100 mcg/L and a TSAT level ≥ 20%.2
- NKF-KDIGO® guidelines state that in most patients with TSAT > 30% or serum ferritin > 500 ng/mL, any erythropoietic response to iron supplementation alone (ie, incremental change in Hb and/or reduction in ESA dose) will be small.3
- Evaluate the iron status in all patients before and during treatment and maintain iron repletion.
ESA dose, iron use, and Hb levels over time4
Between 2002 and 2008, Hb levels correlated with ESA doses; iron doses did not demonstrate the same correlation†
Retrospective cohort analysis of data from patients on hemodialysis between 2002 and 2008 in the United States Renal Data System (USRDS) database. Total N varied for each study year with a range of 233,547–280,400. For each study year, incident and prevalent hemodialysis patients were identified and demographic information gathered. Medicare claims data identified EPOGEN® dose, Hb (Hct/3), and provider ID. Iron dose was sum of all iron formulations. To account for the possibility of changes in the demographic and clinical characteristics of the cohorts over time, population marginal means were calculated for mean EPO dose/month, mean total iron dose, and mean Hb level for each quarter-year, controlling for demographic (sex, age, race, ethnicity, and Medicaid status) and clinical (disease cause, dialysis vintage, and comorbidities) characteristics.
†Analyses limited to individuals who received EPOGEN® for at least one month of the quarter.
†Analyses limited to individuals who received EPOGEN® for at least one month of the quarter.